Explore Data
The Explore GW event parameters tab allows users to download skymaps of GW events and analyze parameter distributions with histograms and scatter plots. To understand the meaning of the different parameters names you can have a look at this link (under “Event Portal”). This tab is organised in two main sections:
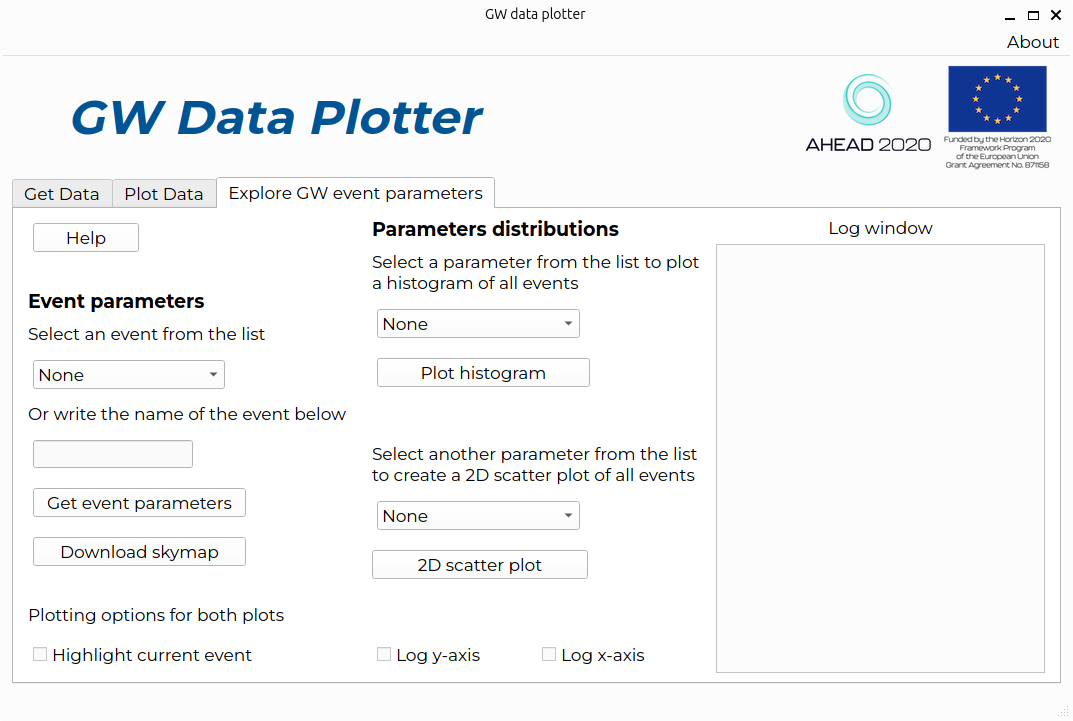
Event parameters
The section Event parameters is useful to explore the parameters of a single known GW event. Users can select an event from a list of showcase events or type the name of a published event. By clicking on Get event parameters users can, then, get the event’s main parameters, that will be displayed in the Log window.
It is also possible to download the skymap for the selected event (skymap is the event’s localization
on the sky) using the button Download skymap.
Note that in this last case, the skymap will be downloaded on your PC as a png file and then shown.
Parameters distributions
The Parameters distributions section gives the possibility to retrieve the values of selected GW event parameters from all published catalogs and plot them as either a histogram or a two-dimensional scatter plot.
The selected GW event parameters are:
primary mass of the binary system
secondary mass of the binary system
chirp mass
remnant mass
luminosity distance
signal-to-noise ratio
merger time
The procedure to create a histogram and a scatter plot is the following:
Select one parameter from the drop-down menu.
Use the button Plot histogram to get the distribution of values on that parameter (the parameter values for all published events are downloaded automatically).
Select another parameter from the lower drop-down menu.
Use the button 2D scatter plot to get a scatter plot with the first parameter on the x-axis and the second on the y-axis (the parameter values for all published events are downloaded automatically if needed).
If users have previously downloaded the parameters of a specific GW event, they have the option to highlight it in the histogram and scatter plots by selecting the check box Highlight current event.
The axes of the plots can be set to logarithmic scale by using the corresponding checkboxes. Note, however, that if you enable Log x-axis when plotting a histogram you will have a histogram of the logarithm of the parameter value.